

|


|
|
|
|
|
 |
 he ISEEMORE app, connected to the central database just like the website, provides input and output functions that are simple to use and are fast. Also, smartphone functionality is used to its best advantage.
 Organisations can be displayed on the map. The colour scheme is used to indicate the status of an organisation. Clicking on the organisation navigates to the underlying organisations or can zoom in to the organisation, which displays the KPI report for the current or previous periods.
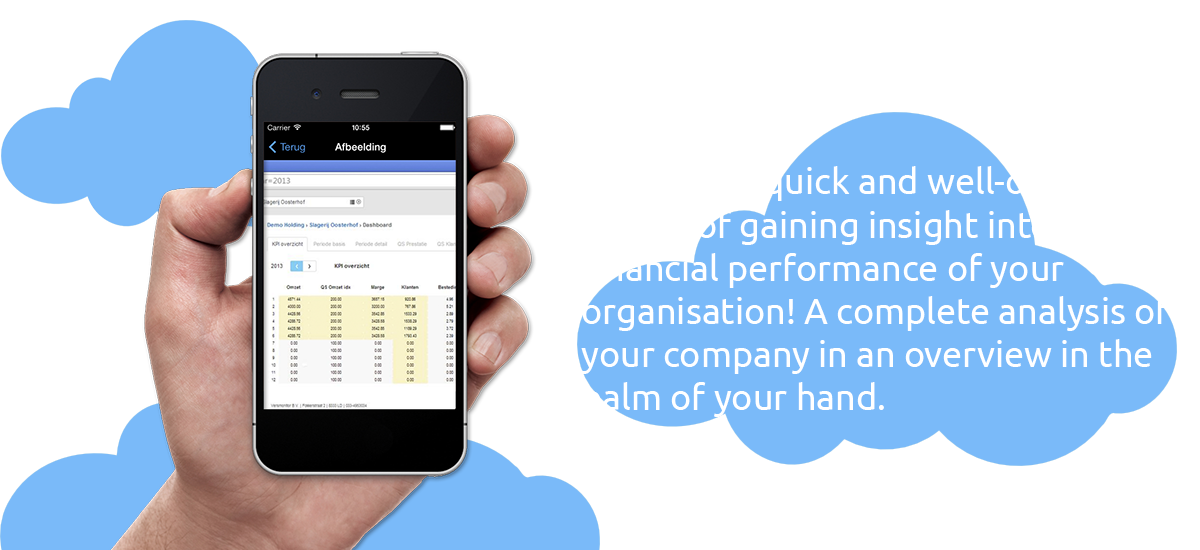
 he actual data within a period can be input and viewed for each booking period. The input option via the app is intended to provide a fast way to gain insight into performance.
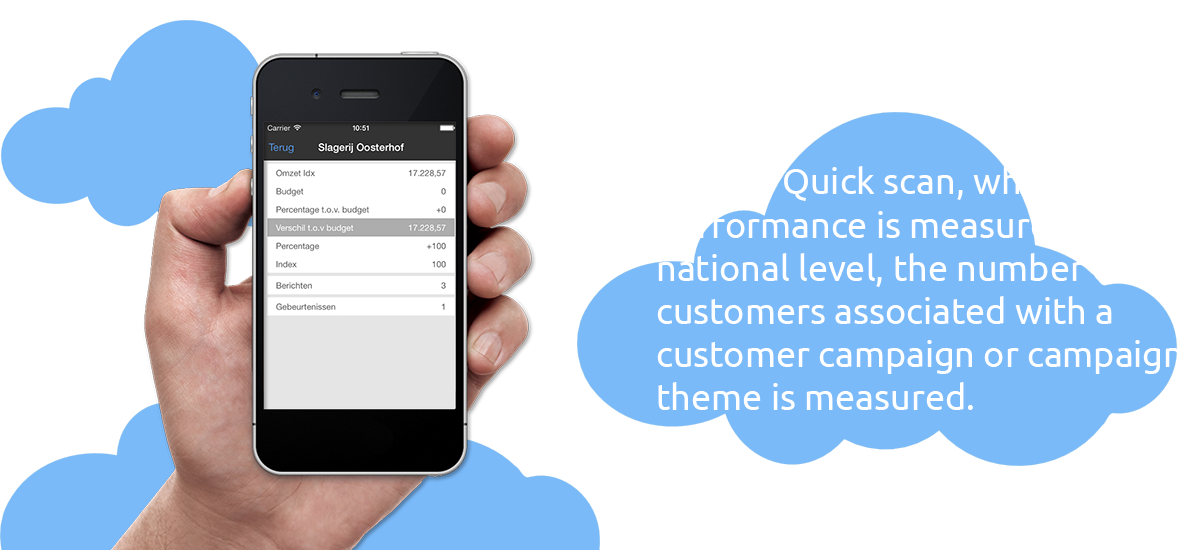
 In addition to financial data, the data for operational results also provides insight into the performance of an organisation. For example, shop performance can be measured by the average amount spent per number of customers.
 Documents are photographed using a smartphone and metadata is added, and this is then saved in the digital file.
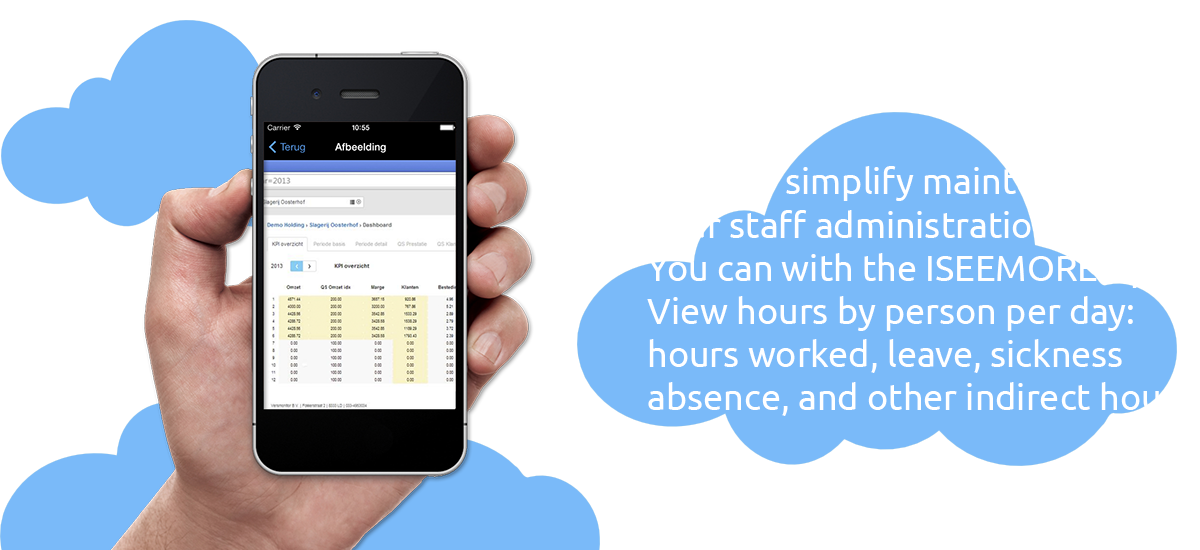
 Hours can be recorded by person per day: hours worked, leave, sickness absence, and other (indirect) hours. In addition, the relationship with planned hours is immediately viewable.


The ISEEMORE app, connected to the central database just like the website, provides input and output functions that are simple... Read more

Organisations can be displayed on the map. The colour scheme is used to indicate the status of an organisation. Clicking... Read more

The actual data within a period can be input and viewed for each booking period. The input option via the... Read more

In addition to financial data, the data for operational results also provides insight into the performance of an organisation. For... Read more


